
Imagine trying to measure how an aircraft wing flexes in flight without running electrical strain-gauge wires across every part of its structure. One option is to embed a strand of optical fiber, illuminate it, and look for a tiny shift in the wavelength of light reflected from selected points. The fiber does not need a battery at each sensing point. Its measuring marks are written into the glass itself.
The device is a fiber Bragg grating (FBG). Its ingenious trick is to turn a microscopic change in length into a change in colour—more precisely, in optical wavelength, usually in the infrared. That shift can be measured remotely with a spectrometer-like interrogator. What looks like a communications fiber becomes a distributed set of tiny mechanical rulers.
Explore: the structure moves, but where?
A strain gauge measures how much a material stretches relative to its original length. A conventional foil gauge changes electrical resistance as it deforms, and needs electrical connections and suitable readout circuitry. This is a mature, excellent technology, but extensive wiring can become awkward on a large or electromagnetically noisy structure. Engineers may want dozens of sensing points on a wing, a composite pressure vessel, or a long bridge member.
An optical fiber is thin, light, electrically insulating and compatible with long cable runs. Yet an ordinary fiber mainly transports light; it does not announce which particular segment was stretched. The challenge is to give selected millimetres of that fiber their own readable optical signatures.
That is what the grating does. In the late 1980s, researchers demonstrated how to write periodic refractive-index changes into a germanosilicate fiber using ultraviolet interference patterns. Those barely perceptible changes form a wavelength-selective reflector, not a mirror in the usual sense. The original work by Meltz, Morey and Glenn (1989) established an influential fabrication route.
Understand: many weak reflections cooperate
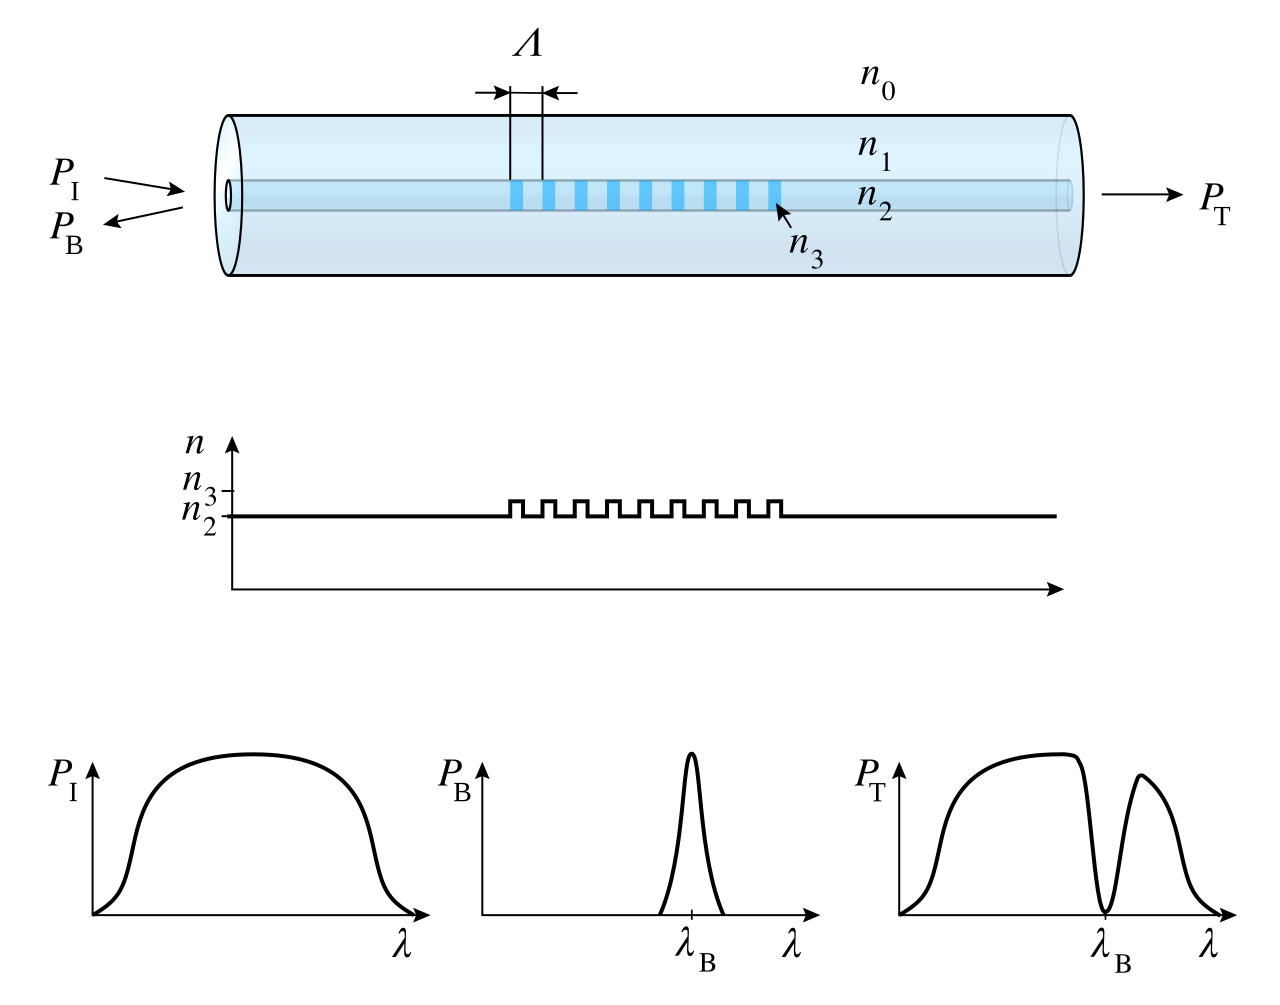
Imagine a short section of fiber whose core has alternating regions of slightly higher and lower refractive index. Each transition sends back only a very weak part of the incoming light. Normally these reflections mostly cancel one another. But for one particular wavelength, the backward-going waves from successive periods arrive in step and add coherently.
The condition for that reinforcement is the Bragg relation:
λB = 2 neff Λ
Here λB is the reflected wavelength in vacuum, neff is the effective refractive index experienced by the guided mode, and Λ is the physical spacing of the grating periods. The factor of two appears because the light travels between neighbouring scattering sites and back: the optical path difference is approximately 2neffΛ. When that equals one wavelength, the reflections reinforce each other.
For example, a fiber with neff ≈ 1.45 reflecting around 1550 nm needs a grating period of about 534 nm. The index modulation is small, but hundreds or thousands of regularly spaced contributions can create a conspicuous narrow reflection peak. A broadband source sends many wavelengths down the fiber; the grating returns a narrow band while most other wavelengths continue onward.
Now pull the fiber gently. The grating spacing Λ grows, which would move the reflection peak to longer wavelengths. But there is a second effect: mechanical strain changes the effective refractive index through the photoelastic effect. The two changes partially oppose each other. This detail is why the sensor’s calibration cannot simply be read off from the geometrical stretching of the grating.

From a shifted peak to a number
For small axial strain ε at constant temperature, a common first-order approximation is:
ΔλB / λB ≈ (1 − pe) ε
The effective photoelastic coefficient pe is roughly 0.22 for a typical silica fiber, so only about 78% of the fractional strain appears as a fractional wavelength shift. At 1550 nm, this gives approximately 1.2 picometres per microstrain (1 µε means a relative extension of one part in a million). That figure is representative, not a universal calibration constant: fiber composition, coating, packaging and installation matter.
Consider a sensor bonded to a structural member. If it experiences 100 µε, the predicted shift is:
ΔλB ≈ 1550 nm × 0.78 × 100 × 10−6 = 0.121 nm = 121 pm.
A movement of just 121 picometres in the spectral peak tells us about a hundred-millionth-scale fractional elongation. The remarkable part is not that the glass stretches: it is that a wavelength-selective optical structure converts that stretch into something an instrument can locate precisely.
But resolution is not the same as accuracy. In a NIST study of FBG metrology, even wavelength differences of 1 pm were consequential, and a multi-laboratory comparison found much larger differences in some measured peaks. Interrogator calibration, the exact peak-finding algorithm and long-term stability are engineering problems, not footnotes.
The hidden complication: temperature imitates strain
Heating the fiber also shifts the Bragg wavelength: the grating expands and the glass refractive index changes with temperature. Around 1550 nm, a typical bare silica FBG may shift by roughly 10 pm per kelvin. The actual response depends on the fiber and its mounting. This means a 10 °C temperature change can imitate roughly 80 µε of strain if temperature is ignored.
Our 100 µε example could therefore produce about 121 pm from strain plus 100 pm from a 10 °C rise: 221 pm in total. If an engineer interpreted the whole shift as strain, the estimate would be about 183 µε instead of 100 µε. The sensor has not failed to measure the wavelength; the interpretation has failed to distinguish two causes of the same signal.
A practical design often uses a nearby strain-isolated reference grating that feels the temperature but not the mechanical load. Subtracting its appropriately calibrated thermal response from the bonded grating’s response isolates the strain contribution. Other designs use two sensors with different sensitivities or an independent thermometer. Temperature compensation is part of the instrument, not an optional software embellishment.
One thread, many addresses
There is another elegant feature. A manufacturer can write several gratings along the same fiber, each with a slightly different period Λ and therefore a different nominal reflection wavelength. When the interrogator sees multiple peaks, it knows which grating each peak belongs to—provided the peaks remain distinguishable over the expected measurement range.
This is wavelength-division multiplexing for sensing: several physical locations share one optical path and one reader. The trade-off is spectral space. Each grating needs enough room to shift with strain and temperature without overlapping its neighbours. Large measurement ranges, broad peaks or strong gradients reduce the number that can coexist cleanly. It is not an unlimited number of sensors on a magic cable.
The approach extends beyond measuring one axial stretch. NASA Langley describes multicore fibers with Bragg gratings in three cores, bonded to or embedded in an airframe. Bending strains the cores differently; those differences can be used to reconstruct the fiber’s three-dimensional shape. The important distinction is that a single ordinary FBG measures a local spectral response, while shape reconstruction requires geometry, multiple strain readings, calibration and an algorithm.
Where the trick becomes difficult
- Bonding and strain transfer: a grating only reports the strain actually transmitted into the fiber. Adhesive creep, debonding, protective coatings and local stress concentrations can bias readings.
- Temperature cross-sensitivity: without compensation, a wavelength shift cannot be assigned uniquely to strain.
- Nonuniform strain: a grating stretched differently along its length can broaden or distort its reflection peak. Tracking only the peak centre may hide useful information or give a misleading result.
- Calibration and drift: the light source, wavelength reference and interrogator algorithm determine whether picometre-level readings are trustworthy over months or years.
- Mechanical survivability: the glass fiber and its connectors need protection. Embedding a sensor in a composite may improve integration while complicating repair and replacement.
These limitations are why a successful sensing system is more than a fiber plus a wavelength formula. It includes mechanical design, thermal references, spectral processing, data validation and a plan for what happens when one sensor becomes unreliable.
Shape: an experiment you can run without an optical lab
Build a small numerical model with two Gaussian-shaped reflection peaks. Put the first at 1550.000 nm and the second at 1550.121 nm. Plot them on a wavelength axis: that separation represents about 100 µε at the assumed sensitivity. Now shift the second peak by another 0.100 nm to represent a 10 °C temperature rise. Your model will report an apparent strain of roughly 183 µε unless you introduce a temperature reference.
Next add a third trace from an unstrained reference grating, shifting only by 0.100 nm. Subtract its measured movement from the sensing grating’s 0.221 nm shift; the remaining 0.121 nm recovers the intended 100 µε. Finally, broaden one of the peaks asymmetrically to mimic nonuniform strain and ask whether your peak-finding method still returns the right centre.
This is a useful general lesson in measurement science: we rarely observe the desired quantity directly. We observe a physical signature, then infer its causes. The clever part is to design the signature so that the inference is sensitive, calibrated and falsifiable.
A question to take further: if a bridge or aircraft could continuously map its own deformation, what evidence would justify changing maintenance decisions? A beautiful stream of wavelength data is not yet a trustworthy safety assessment. What independent measurements and failure tests would you demand before relying on it?
Sources and further exploration
- G. Meltz, W. W. Morey and W. H. Glenn, “Formation of Bragg gratings in optical fibers by a transverse holographic method”, Optics Letters 14, 823–825 (1989). Original fabrication research.
- S. D. Dyer et al., “Key metrology considerations for fiber Bragg grating sensors”, NIST/SPIE (2004). Primary metrology study and interlaboratory comparison.
- NASA Langley, Shape Sensing Sensor using Optical Fibers. Application of multicore FBG measurements to airframe shape reconstruction.
- “Fatigue Performance of Type I Fibre Bragg Grating Strain Sensors” (2019). Open-access experimental research on reliability and strain sensing.
Author
What concrete example would confirm or challenge this article?
Choose a reaction, write a comment, or ask your AI assistant to send a proposal for review. Comments are reviewed before publication.