
How do you weigh a layer of material so thin that you cannot pick it up? One answer is to put it on a vibrating crystal and listen for an almost imperceptible change in pitch. A quartz crystal microbalance (QCM) can turn a few nanograms of material spread over a square centimetre into a measurable shift of an electrical oscillation. No miniature balance pan is needed.
The trick is to use a resonator as both the object being loaded and the ruler that detects the load. Add a sufficiently thin, rigid film, and the crystal oscillates a little more slowly. This is a useful example of an engineering principle: measure a small mechanical quantity by converting it into a frequency, because frequency can be counted with extraordinary precision. The word microbalance describes the application, not a tiny conventional weighing scale.
Explore: a mass too small for an ordinary balance
Imagine depositing a metal coating on a component inside a vacuum chamber. You want to stop when the film reaches the desired thickness. Removing a sample, weighing it, and putting it back would interrupt the process, and the mass added to a small surface might be far below the useful resolution of a laboratory balance.
Instead, place a thin quartz disk near the component. Give the disk metal electrodes and connect it to an electronic circuit that excites and measures its resonance. As the same coating accumulates on the disk, the resonant frequency falls. The disk becomes an in-situ witness of the deposition process.
The central discovery was described by Günter Sauerbrey in 1959. He recognized that a thin, firmly attached film behaves approximately as extra vibrating mass, and that the resulting frequency shift can be predicted from the properties of quartz. It is a beautiful conversion: mass becomes time, or more precisely the number of oscillations per second.

Understand: the crystal is a mechanical clock
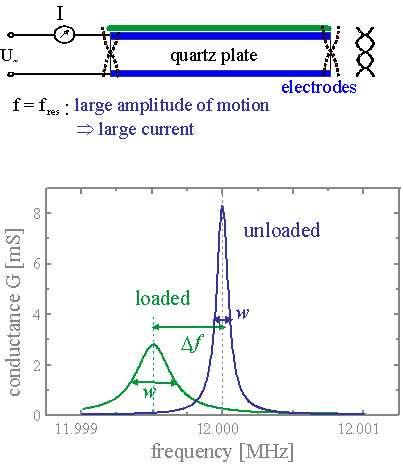
Quartz is piezoelectric: an electric field can deform it, and mechanical deformation can generate an electrical signal. With the appropriate crystal orientation, commonly an AT-cut, a thin quartz plate supports a thickness-shear mode. Its broad faces slide sideways in opposite directions rather than simply moving up and down like a loudspeaker diaphragm. Electrodes on the faces allow an alternating voltage to excite this motion and an electronic circuit to track its resonance.
A simplified picture starts with a shear wave travelling through the thickness t of the plate. If the shear-wave speed is v, the fundamental resonance is roughly f0 = v/(2t). A thinner plate resonates at a higher frequency. The actual device includes electrodes, mode shape and acoustic boundary conditions, but the standing-wave idea is the right starting point.
Now coat one face with a very thin film that sticks tightly to the quartz and moves with it. The film must be accelerated and decelerated on every cycle. It adds inertia to the vibrating structure without contributing much additional restoring force. Consequently, the resonance moves downward. The shift is tiny compared with the several-million-hertz carrier frequency, but it is measurable as a difference between two frequency readings.
This is not a weighing method based on gravity. Turn the instrument sideways or use it in microgravity and the essential mechanism remains. The quartz senses acoustic loading, not the weight force mg.
The mathematical trick: the Sauerbrey equation
For a thin, laterally uniform, rigid film firmly coupled to the quartz, the first-order Sauerbrey relation for the fundamental mode can be written in terms of added mass per unit active area, Δσ:
Δf = −[2 f02 / √(ρq μq)] Δσ
Here f0 is the unloaded fundamental frequency, ρq is quartz density, and μq is its effective shear modulus. The square root, √(ρq μq), is the shear acoustic impedance of quartz. If you instead use total deposited mass Δm, divide it by the relevant area A: Δσ = Δm/A.
Why the square of frequency? Since f0 is inversely proportional to crystal thickness, a thinner, faster resonator is more sensitive to an additional mass per area. The relation predicts that, within its assumptions, doubling the fundamental frequency increases mass sensitivity by a factor of four. That advantage is not free: very thin crystals are more fragile, and electrical and mechanical noise still matter.
For a commonly used 5 MHz AT-cut quartz resonator, the Sauerbrey sensitivity is approximately 56.6 Hz per microgram per square centimetre, equivalently 0.0566 Hz per nanogram per square centimetre. Consider a rigid coating adding just 10 ng/cm². The expected change is:
Δf ≈ −0.0566 × 10 Hz = −0.566 Hz.
The resonance would move from 5,000,000.000 Hz to about 4,999,999.434 Hz in this idealized example. The relative shift is only about 1.1 × 10⁻⁷. Measuring a sub-hertz difference on a megahertz oscillator is the clever part. It requires a sufficiently stable reference, suitable measurement time, and careful control of drift; it does not mean every QCM can determine mass to 10 ng/cm² in every environment.
| State | Surface load | Illustrative resonance | What changes? |
|---|---|---|---|
| Clean crystal | Baseline | 5,000,000.000 Hz | Quartz supplies the reference |
| Thin rigid coating | +10 ng/cm² | 4,999,999.434 Hz | Added inertia lowers frequency |
| More rigid coating | +100 ng/cm² | 4,999,994.340 Hz | Approximately ten times the shift |
Illustrative values, not measurements. They assume the Sauerbrey regime, uniform loading, the fundamental mode and negligible environmental drift.
What the electronics actually measure
A QCM is an electromechanical resonator. One measurement strategy places it in an oscillator circuit and counts cycles against a stable time reference. Another sweeps an electrical excitation across frequency and measures the complex impedance or admittance peak. More advanced instruments monitor several odd overtones and how quickly the oscillation decays after excitation stops.
These methods are related but not identical. In a lightly damped resonator, the resonance is sharp and its centre can be estimated accurately. As damping increases, the resonance broadens and a simple oscillator may track a frequency that depends on the electronic circuit as well as the sample. A meaningful mass reading therefore needs an understanding of which resonance quantity the instrument reports.
There is a deeper insight here: a resonator is a frequency-domain amplifier of small changes in its own dynamics. A tiny mechanical load may be difficult to detect as a displacement, but much easier to detect as the accumulated phase difference between an oscillator and a stable reference. Related ideas appear in fiber Bragg strain sensing, where deformation shifts an optical wavelength, and in Vernier timing, where small differences are made observable by comparison.
The trap: a frequency shift is not always a mass change
The elegant Sauerbrey formula is a model with conditions, not a universal mass meter. A soft polymer layer can deform internally instead of moving rigidly with the quartz. A rough or patchy deposit can produce a response different from that of a uniform film. Temperature, stress, surface chemistry and electronics can all shift the observed frequency. And when a crystal operates in liquid, it drags nearby fluid into oscillatory motion.
That last case is especially important. Immersing a QCM in a liquid typically lowers its resonance and increases energy loss even if no molecules have adsorbed. The frequency responds to the liquid’s density and viscosity as well as to material attached to the surface. Kanazawa and Gordon developed a quantitative account of this viscous loading in 1985. Calling every negative frequency shift “more mass” in such a system would confuse a change in the environment with a change in the sample.
Engineers therefore often measure dissipation in addition to frequency. Dissipation describes how much vibrational energy is lost per cycle; a soft, water-rich film may cause significant extra loss while a stiff, compact film produces a cleaner mass-like shift. Quartz crystal microbalance with dissipation monitoring, often abbreviated QCM-D, uses this additional observable to investigate proteins, membranes and other soft interfaces. Even then, extracting a unique film mass and viscoelasticity can require assumptions or complementary measurements.
A useful practical question is not simply “How much did the frequency change?” but “What mechanical load would cause this change, and what alternative explanations have we ruled out?”
Shape: put the crystal to work
Thin-film fabrication. During vacuum deposition, a QCM can monitor growth in real time. If the film density and the relationship between deposition at the crystal and at the product are known, the signal can be translated into an estimated thickness. The tooling factor, geometry, crystal ageing and coating properties must be calibrated. The crystal measures what arrives at its position, not automatically what reaches every part of the workpiece.
Electrochemistry. A gold-coated quartz electrode can serve as both an electrochemical surface and a resonator. Suppose copper is deposited by Cu²⁺ + 2e⁻ → Cu. Under ideal 100% current efficiency, 1 millicoulomb of charge corresponds, by Faraday’s law, to about 0.329 micrograms of copper. Spread uniformly over 1 cm² on a 5 MHz crystal, that would give a Sauerbrey shift of roughly −18.6 Hz. Comparing the observed frequency shift with the passed charge can reveal whether the process is consistent with the expected deposition, although solvent coupling, roughness and side reactions complicate interpretation.
Surface chemistry and biosensing. Functionalize a crystal surface to bind a chosen molecule and observe the loading change as the molecules arrive. The attractive feature is that no fluorescent or radioactive label is intrinsically required. The hard part is distinguishing specific binding from nonspecific adsorption, changes in hydration, and shifts in liquid properties. A reference channel and controlled rinsing protocol often matter as much as raw frequency sensitivity.
A thought experiment you can simulate
Build a minimal virtual QCM experiment in a spreadsheet or a short script. Begin with a 5 MHz reference and a rigid-film sensitivity of −0.0566 Hz/(ng/cm²). Let the surface mass grow linearly from 0 to 200 ng/cm² over 200 seconds. Plot the predicted frequency trace. Then add three realistic disturbances: a slow baseline drift of +0.02 Hz per minute, random frequency noise with a standard deviation of 0.05 Hz per reading, and a sudden −2 Hz step that represents a change in liquid loading rather than added mass.
First, convert every frequency change directly into mass using the Sauerbrey constant. The inferred mass curve will show an apparent jump and drift. Next, introduce an identical but uncoated reference crystal and subtract its common-mode drift. Finally, imagine measuring dissipation and noticing that the −2 Hz event coincides with a large rise in energy loss. Which parts of the mass trace would you now trust?
For a physical demonstration, a supervised laboratory setup could use a commercial QCM, a stable temperature environment, and repeated adsorption/rinsing cycles with a safe test substance. The goal is not to achieve the smallest advertised detection limit, but to separate reproducible surface loading from environmental effects.
One broader lesson
The QCM illustrates a recurring design pattern: translate a difficult quantity into a signal that existing instruments can compare with great precision. A quartz disk does not “feel” nanograms in the human sense. It changes its dynamics; electronics measure that change; a physical model turns the result into an estimate of mass. Each link in that chain has assumptions. The ingenuity lies both in creating the conversion and in knowing when the conversion stops being reliable.
What other quantities could be measured more accurately by letting them perturb a stable resonance: pressure, acceleration, magnetic field, chemical binding or even the stiffness of a living cell?
Sources and further exploration
- G. Sauerbrey (1959), “Verwendung von Schwingquarzen zur Wägung dünner Schichten und zur Mikrowägung”, Zeitschrift für Physik 155, 206–222. Foundational primary research.
- K. K. Kanazawa and J. G. Gordon II (1985), “Frequency of a quartz microbalance in contact with liquid”, Analytical Chemistry 57, 1770–1771. Primary work on liquid loading.
- M. Rodahl et al. (1997), “Simultaneous frequency and dissipation factor QCM measurements of biomolecular adsorption and cell adhesion”, Faraday Discussions 107, 229–246. Primary research on dissipation and soft films.
- B. D. Vogt et al. (2004), “Effect of Film Thickness on the Validity of the Sauerbrey Equation for Hydrated Polyelectrolyte Films”, Journal of Physical Chemistry B 108, 12685–12690. Experimental evidence for the limits of the rigid-film approximation.
- Laboratoire Interfaces et Systèmes Électrochimiques, Sorbonne Université/CNRS, “Quartz Crystal Microbalance or QCM”. Accessible laboratory overview of electrochemical applications.
Author
What concrete example would confirm or challenge this article?
Choose a reaction, write a comment, or ask your AI assistant to send a proposal for review. Comments are reviewed before publication.